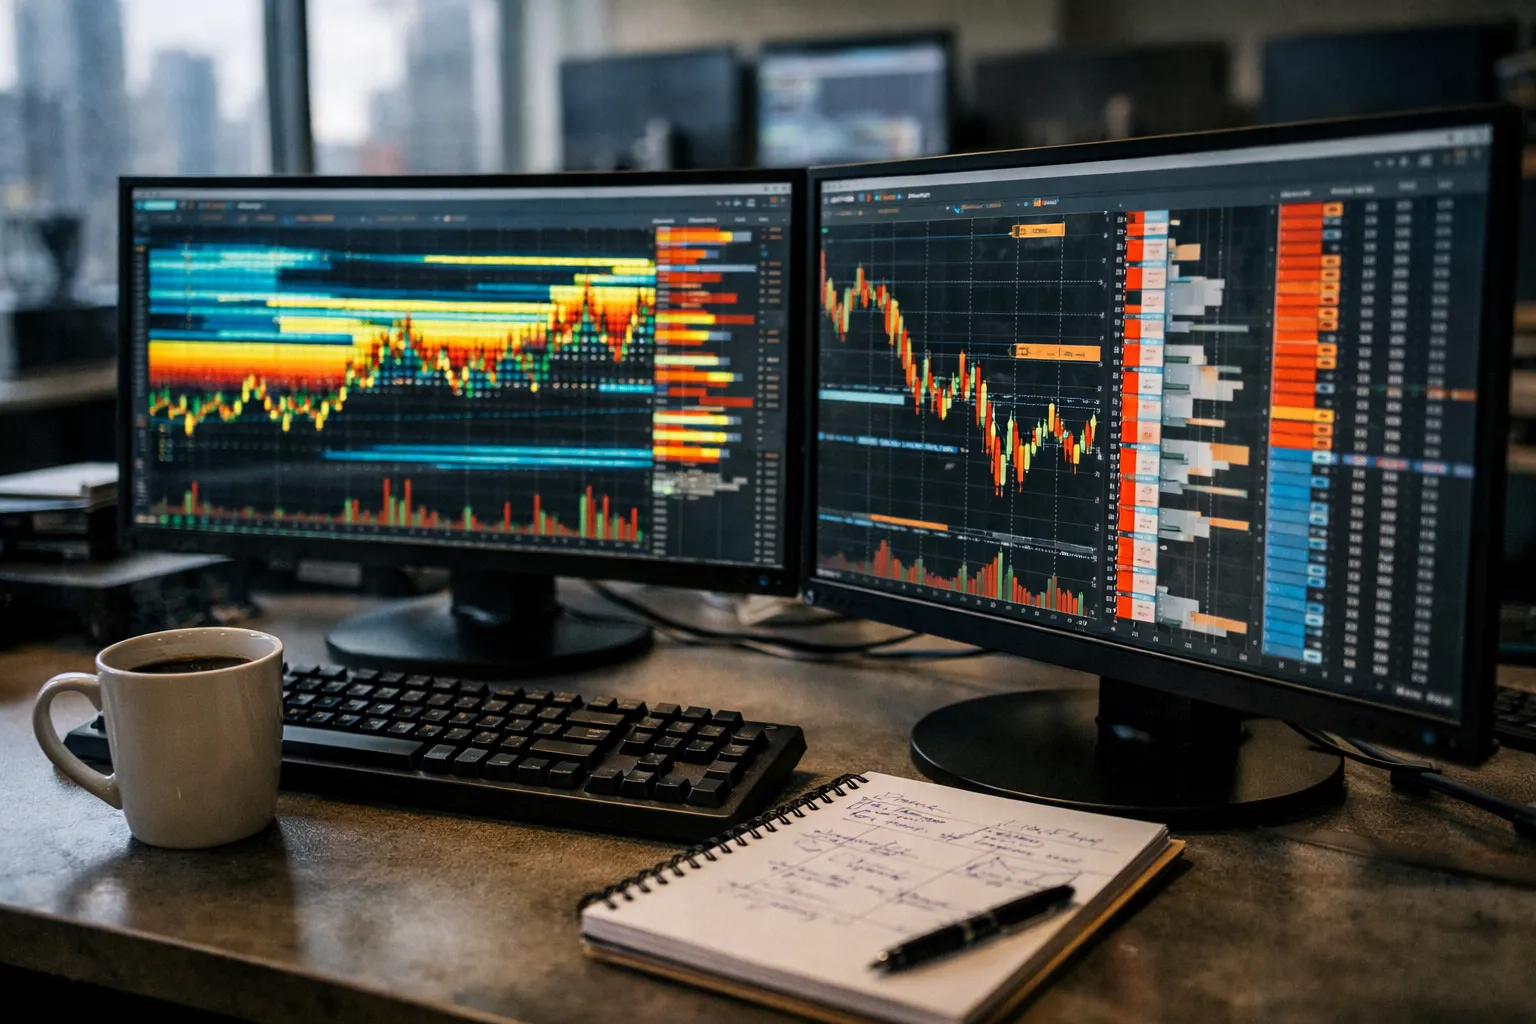
Bookmap has been the go‑to order‑flow heatmap platform for equities and futures for years; its crypto adoption is now mature enough that perpetual traders must decide whether Bookmap Crypto belongs in their toolkit. This review examines Bookmap’s capabilities in mid‑2026, evaluates strengths and limitations for perpetual and market‑making strategies, and provides practical guidance on who should subscribe.
What Bookmap Crypto does
At its core, Bookmap is a visualization and analytics platform that renders the limit order book as a dynamic heatmap, overlays executed volume as “volume dots,” and provides a real‑time DOM (depth of market) view. For crypto traders this translates into:
- Heatmap liquidity surface: visual history of resting liquidity by price and time, making iceberg and layered liquidity visible.
- Volume dots and footprint‑style markers: executed trades sized and colored by aggressor side to show who is taking liquidity.
- OrderBook and DOM integration: live depth and the ability to inspect short‑term liquidity imbalances.
- Exchange connectors & data feeds: direct WebSocket connections to major CEXs and some derivatives venues to reduce aggregation latency.
- Custom indicators and scripting: user‑definable overlays (volume imbalance, VWAP bands, spread alerts) to augment visual cues.
Key improvements and 2026 context
By June 2026 Bookmap’s crypto feature set is polished: more stable exchange connectors, improved handling of shardless orderbook updates from high‑throughput venues (e.g., Binance, Bybit, Coinbase derivatives), and optimized rendering that reduces CPU/GPU load on modern workstations. Importantly, Bookmap remains a visualization and analytics tool — it does not execute trades natively on most exchanges, though some broker plugins can route orders with add‑on integrations.
Strengths for perpetual traders
- Superior microstructure visibility. Perpetual markets are driven by liquidity sweeps, liquidation cascades, and maker/taker flow. Bookmap exposes these events in real time, helping traders identify genuine sweeps versus transient noise.
- Early detection of iceberg orders. The heatmap’s persistence feature makes it easier to spot gradual replenishment patterns that precede large taker attacks.
- Context for execution timing. Combining volume‑dot clusters with DOM movement helps scalpers and market‑makers choose aggressive vs. passive execution moments.
- Custom alerts and scripting. You can build alerts around liquidity thresholds or rapid book shifts — useful for automated strategies that still rely on human confirmation.
Limitations and tradeoffs
- Not an execution platform. Bookmap visualizes; it doesn’t replace an execution venue or a low‑latency API client. Traders needing sub‑10ms decision‑to‑fill workflows will still route orders through dedicated execution systems.
- Data feed costs and complexity. Direct, low‑latency exchange feeds (and stable WebSocket connections) sometimes require paid subscriptions or API tiers at exchanges — an additional expense beyond Bookmap’s subscription.
- Steep learning curve. Interpreting heatmaps and distinguishing signal from structural exchange artifacts takes practice. New users frequently misread liquidity shadows as tradable order flow.
- Hardware demands. High‑resolution heatmaps with multiple exchange connectors benefit from robust CPUs and a discrete GPU; a laptop can struggle under heavy load.
Practical examples
Two common use cases illustrate value:
- Scalping around funding resets. Perpetual funding events often see transient liquidity vacuums. Bookmap makes it possible to see whether apparent depth at a funding‑sensitive price is sticky or being propped up by short‑lived hidden orders.
- Liquidation cascade detection. Bookmap reveals the approach of a cascade: rising volume dots pushing through thin heatmap zones, followed by replenishment at lower prices. Traders can pre‑position hedges or widen spreads accordingly.
Who should use Bookmap Crypto?
Bookmap is best for traders who:
- Rely on order‑flow and microstructure information for entries/exits (scalpers, high‑frequency market‑makers, and institutional flow desks).
- Have separate execution systems and want visual confirmation before committing capital.
- Are willing to invest time learning order‑book dynamics and to pay for quality data feeds and a capable workstation.
Conversely, trend followers and options traders who base decisions on higher‑timeframe signals and implied volatility curves will find limited benefit.
Pricing and tiers (what to expect)
Bookmap offers tiered subscriptions with optional add‑ons. Expect a base subscription for the core app, paid exchange connectors or premium data feeds for low‑latency market data, and additional fees for advanced modules (historical heatmap playback, proprietary indicators). For small traders, total monthly cost can be material once you include exchange API tiers; institutional deployments are negotiated with enterprise licensing.
Alternatives
- Exocharts. Browser‑based heatmap and order‑flow visualization with easier onboarding for traders who prefer a low‑maintenance setup.
- TensorCharts. Compact orderflow tools focused on tick‑level aggregation and footprint charts.
- Sierra Chart. Highly configurable, lower‑level platform for those who want full control and scripting, though setup is technical.
- TradingView + DOM plugins. Limited order‑flow visibility; useful as a lightweight, chart‑centric alternative but less capable for microstructure analysis.
Verdict
Bookmap Crypto remains the most mature heatmap platform for traders who make decisions at the order‑book level. Its visual clarity and analytic depth deliver tangible advantages for perpetual traders who can act on microstructure cues, particularly scalpers and market‑makers. However, Bookmap is an analytic layer — not an execution engine — and its full value appears only when paired with low‑latency feeds, a dedicated execution stack, and the time to master order‑book reading.
Recommendation: Trial Bookmap with a single exchange connector, practice on a paper account or small size, and evaluate whether the visual signals consistently improve your execution and P&L before committing to multiple connectors and higher tiers.